
An IELTS Academic Task 1 pie chart shows how a whole is divided into parts. To describe it accurately, identify that whole first: a budget, population, output, or another quantity. The same 50% could mean half the money, half the people, or half the products sold.
This is where an error can appear that no synonym substitution will fix. If a chart of spending becomes a statement about the number of students, the sentence may sound smooth while misrepresenting the data.
LetsWords includes pie chart tasks, practice for individual criteria, and feedback on complete Task 1 responses. Feedback shows where a grammatical sentence changes the meaning of the data. In the example below, it is the shift from one student’s expenditure to a number of people.
What does a pie chart measure?
Read the title, sector labels, and period. Colours connect sectors to a legend but do not identify the quantity by themselves. If there are several circles, each may have a different total representing 100%.
Here, the circle describes one student’s monthly spending. It neither groups students by category nor compares different years.
A complete Task 1 response should follow the official IELTS Academic Writing format.
This circle represents one student’s spending
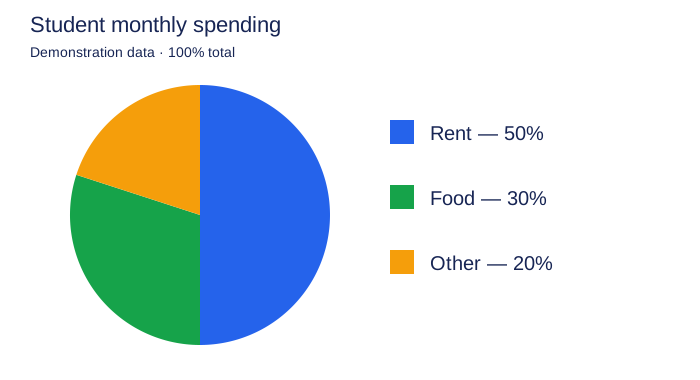
| Category | Share of monthly spending |
|---|---|
| Rent | 50% |
| Food | 30% |
| Other | 20% |
The shares total 100%. Rent takes half, food three tenths, and other expenses one fifth. The total amount of money is not given.
You can therefore compare shares but cannot state the exact rent. A claim that the student pays 500 for housing would require the total amount spent, which the chart does not provide.
“Half of the students”: what LetsWords feedback identifies
Half of the students spent money on rent.
What LetsWords feedback explains — Task Achievement. The whole has been identified incorrectly. Half of the students describes a proportion of people. Here, 100% represents one person’s monthly spending. The percentage has been attached to people instead of money. Correct what follows half of, keeping rent’s share unchanged.
This shift is easy to miss because student, rent, and half all belong to the context. The error lies in how they are connected: the proportion describes a different quantity.
Before revising, ask a plain question: half of what? Here, half of the monthly spending. That is the quantity the English wording must retain.
Corrected sentence:
Rent accounted for half of the student’s monthly spending.
Now half refers to spending, and rent identifies the category. Accounted for expresses the proportion of the whole represented by that category.
The percentage expresses the same idea:
Rent accounted for 50% of the student’s monthly spending.
Both versions match the illustration. Choosing half or 50% leaves the data intact when the whole stays the same. Changing it to half the students would change the content.
Try a free sentence check on account for. Name the part and whole explicitly so you can check whether the proportion is attached to the right noun.
See what this feedback finds in your response.
Can you call 50% a majority?
Imprecise: Rent accounted for the majority of spending.
Precise: Rent accounted for half of the student’s spending.
The majority normally means more than half. Rent is exactly 50% here, so half expresses the value more accurately.
You can also say the largest share, because 50% exceeds each of the other categories. The largest share and a majority are not the same. The largest category in a pie chart may be less than half the total.
Check the basis of your comparison: are you comparing a share with each other sector, or with the whole? That determines which expression fits.
30% versus 20%: how large is the difference?
Imprecise: The share spent on food was 10% higher than the share for other expenses.
Unambiguous: The share spent on food was 10 percentage points higher than the share for other expenses.
Food represents 30% and other expenses 20%. The difference is 10 percentage points. As a relative comparison, 30 is 50% greater than 20. These measures answer different questions.
There is no need to complicate a Task 1 passage with a relative calculation unless it helps the comparison. State the two shares or their difference in percentage points.
Do not use rose or increased for this comparison. You are comparing two spending categories within one period, not a figure changing over time.
Why 50% cannot tell you the rent amount
Unsupported: The student spent 500 dollars on rent.
Supported: Half of the student’s monthly spending went on rent.
To calculate an amount from 50%, you need the total expenditure. The chart does not provide it. Even if 500 seems plausible, it is added information.
A related mistake is comparing absolute spending across two pie charts whose total expenditures differ. A larger share of a smaller total does not necessarily represent more money. Our example has only one circle, so that comparison is not needed at all.
Accurate description communicates the available data without filling gaps from everyday expectations.
Make the comparison easy to read
Once you know the whole, choose a simple comparison: rent is 50%, whereas food is 30%. Whereas connects two shares of the same total here.
Do not add a cause the task does not supply. Due to high rents would explain the share through expensive rent, but the chart gives no reason for the share. Use the free check on due to to practise that expression in a situation where the cause is known.
Do not replace spending with every available related noun. Cost, budget, income, and expenses do not mean exactly the same thing. Income does not become spending for the sake of variety, and a budget may include money not yet spent. Preserve the meaning of the chart’s title.
What to practise on the next task
The main check on another pie chart stays the same: what represents 100%, and what does each number describe? The categories, periods, and shares change, so you cannot transfer the finished sentence without reading the task.
The line graph worked example shows how observations connect in a full visual response. For proportions, practise naming the part and whole precisely.
In LetsWords IELTS Writing Task 1, you work with another chart and receive feedback on what you wrote: what the share refers to, whether the comparison matches the values, and whether unsupported details have appeared. The reference guide and checklist help before submission. Start with one criterion and continue to a complete response.
Choose LetsWords to check accuracy on charts you have not already studied. This example has explained a percentage error; the next step is to test the decisions you make independently. Start preparing, select your goal and level, and try the feedback before paying.