
In IELTS Academic Writing Task 1, a bar chart response should describe important features and compare data where appropriate. Listing every bar may preserve the numbers while leaving the main work to the reader: finding out how the categories differ.
The three sentences below report every value correctly. Yet the relationship between the largest and smallest groups is missing. One change gives the passage a meaningful comparison, without requiring rare vocabulary.
LetsWords provides bar chart tasks, practice focused on individual criteria, and feedback on complete Task 1 responses. It identifies where listing numbers has replaced comparison. You revise the selected passage and try the skill again on another chart.
What a bar chart task asks you to describe
A bar chart represents values through the length or height of bars. Categories might be countries, age groups, products, or learning formats. Some charts include several years; others show one point in time. This determines whether you describe change or differences.
The official IELTS Academic format requires at least 150 words for Task 1.
Before writing, identify what is measured. A number of people, a percentage of participants, and an amount of money can all appear as similar bars. They require different nouns and observations. A colour cannot replace the axis label.
Courses in 2025: what the three bars show
The illustration shows adults enrolled in three course formats in 2025.
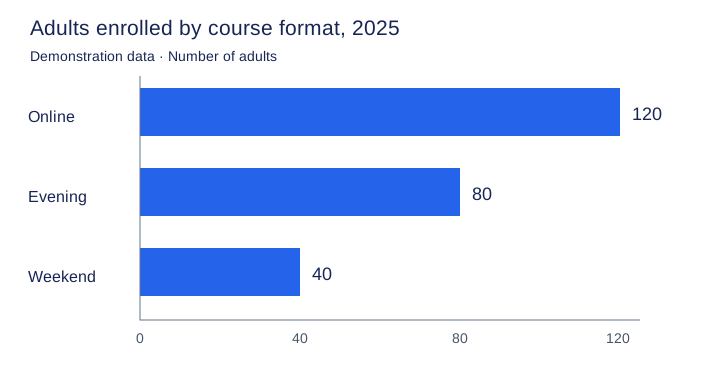
| Format | Number of adults |
|---|---|
| Online courses | 120 |
| Evening classes | 80 |
| Weekend classes | 40 |
The data covers one year. Online courses have the largest group and weekend classes the smallest. The difference is 80 people; the online group is also three times the size of the weekend group.
Both observations are correct but describe different relationships. The absolute difference says how many more participants one format has. The ratio shows its scale relative to the smaller group. Choose according to the comparison you want to highlight.
Three accurate sentences that do not yet compare
Online courses had 120 students. Evening classes had 80 students. Weekend classes had 40 students.
What LetsWords feedback explains — Task Achievement. The values 120, 80, and 40 are accurate. However, the passage does not highlight a relationship between the categories. Readers must notice for themselves that online enrolment is three times weekend enrolment. Add that comparison and support it with the figures.
Repeating students is not the central problem. You could replace the noun in each sentence and still have a list. Improving the passage means changing the content: connecting two categories through one observation.
Revised passage:
Online courses attracted three times as many students as weekend classes, with 120 and 40 enrolments respectively.
The sentence now states the scale of the difference and supports it with numbers. Three times as many students as connects the categories. Respectively preserves their order: 120 belongs to online courses and 40 to weekend classes.
The passage highlights a difference rather than just reporting values. Evening classes can be covered in another sentence of the response.
You can express the comparison without respectively if the ordering becomes hard to follow. A useful sentence should be clear on first reading. Not every observation needs an unusual word.
See what this kind of feedback finds in your response.
Ratios, growth, and units: when wording changes the data
120 versus 40: an ambiguous ratio
Less clear: Online courses had three times more students than weekend classes.
Unambiguous: Online courses had three times as many students as weekend classes.
For 120 versus 40, three times as many clearly states a 3:1 relationship. Three times more can be read ambiguously, so choose the clearer construction here.
An absolute difference produces another sentence:
Online courses had 80 more students than weekend classes.
This is also correct. But 80 is the difference, neither a percentage nor the size of the smaller group. Do not mix the comparison methods automatically.
One year: where did the growth come from?
Unsupported: Online enrolments rose to 120 in 2025.
Supported by the chart: Online enrolments stood at 120 in 2025.
Rose implies an earlier, lower figure. The chart provides no earlier value. We know the number for 2025 but not whether it was higher or lower in 2024.
This is an easy trap after memorising trend verbs. A bar chart does not necessarily show change over time. Let the data determine the expression.
Practise the distinction between a figure increasing and someone increasing it with the free sentence check on rise vs raise.
40 people is not 40 percent
Incorrect: Weekend classes accounted for 40% of enrolments.
Correct for the chart: Weekend classes had 40 students.
The illustration shows 40 people, not 40%. To report a share, you would need to calculate its proportion of the total and make the basis clear. You cannot simply attach a percent sign to a familiar figure.
The noun matters too. Students, courses, and classes refer to different things. If the axis counts learners, There were 120 online courses changes what is being measured.
The expression account for is useful for shares. On the free page, write a sentence and check that the share is linked to the right total.
Keep the meaning when choosing vocabulary
Accuracy matters more than using a different verb each time. Had, recorded, and attracted are not always interchangeable. Here, people enrolled in courses, so attracted suits the situation. The same verb would not fit spending or temperature.
Do not supply reasons the data does not show. Saying online courses are more popular because they are cheaper adds information absent from the illustration. Your description should report the observed relationship.
For a longer worked response, see the IELTS line graph example. It shows how individual observations function within an answer to a different visual task.
Practise comparison in LetsWords
In IELTS Writing Task 1 practice, you choose a new visual task and decide what to compare. LetsWords lets you focus on Task Achievement: select an observation, write a passage, and receive an explanation of whether it communicates an important relationship in the data. For a complete response, a format guide, checklist, and feedback across four criteria are available.
The next bar chart will contain a different relationship, so a memorised line about courses will not be enough. LetsWords checks the choices you make: which categories you compare, where the figures come from, and what the verb claims. Start preparing in LetsWords, choose your goal and level, and try the feedback before paying. Practise finding a comparison independently and get feedback on that decision.